top of page
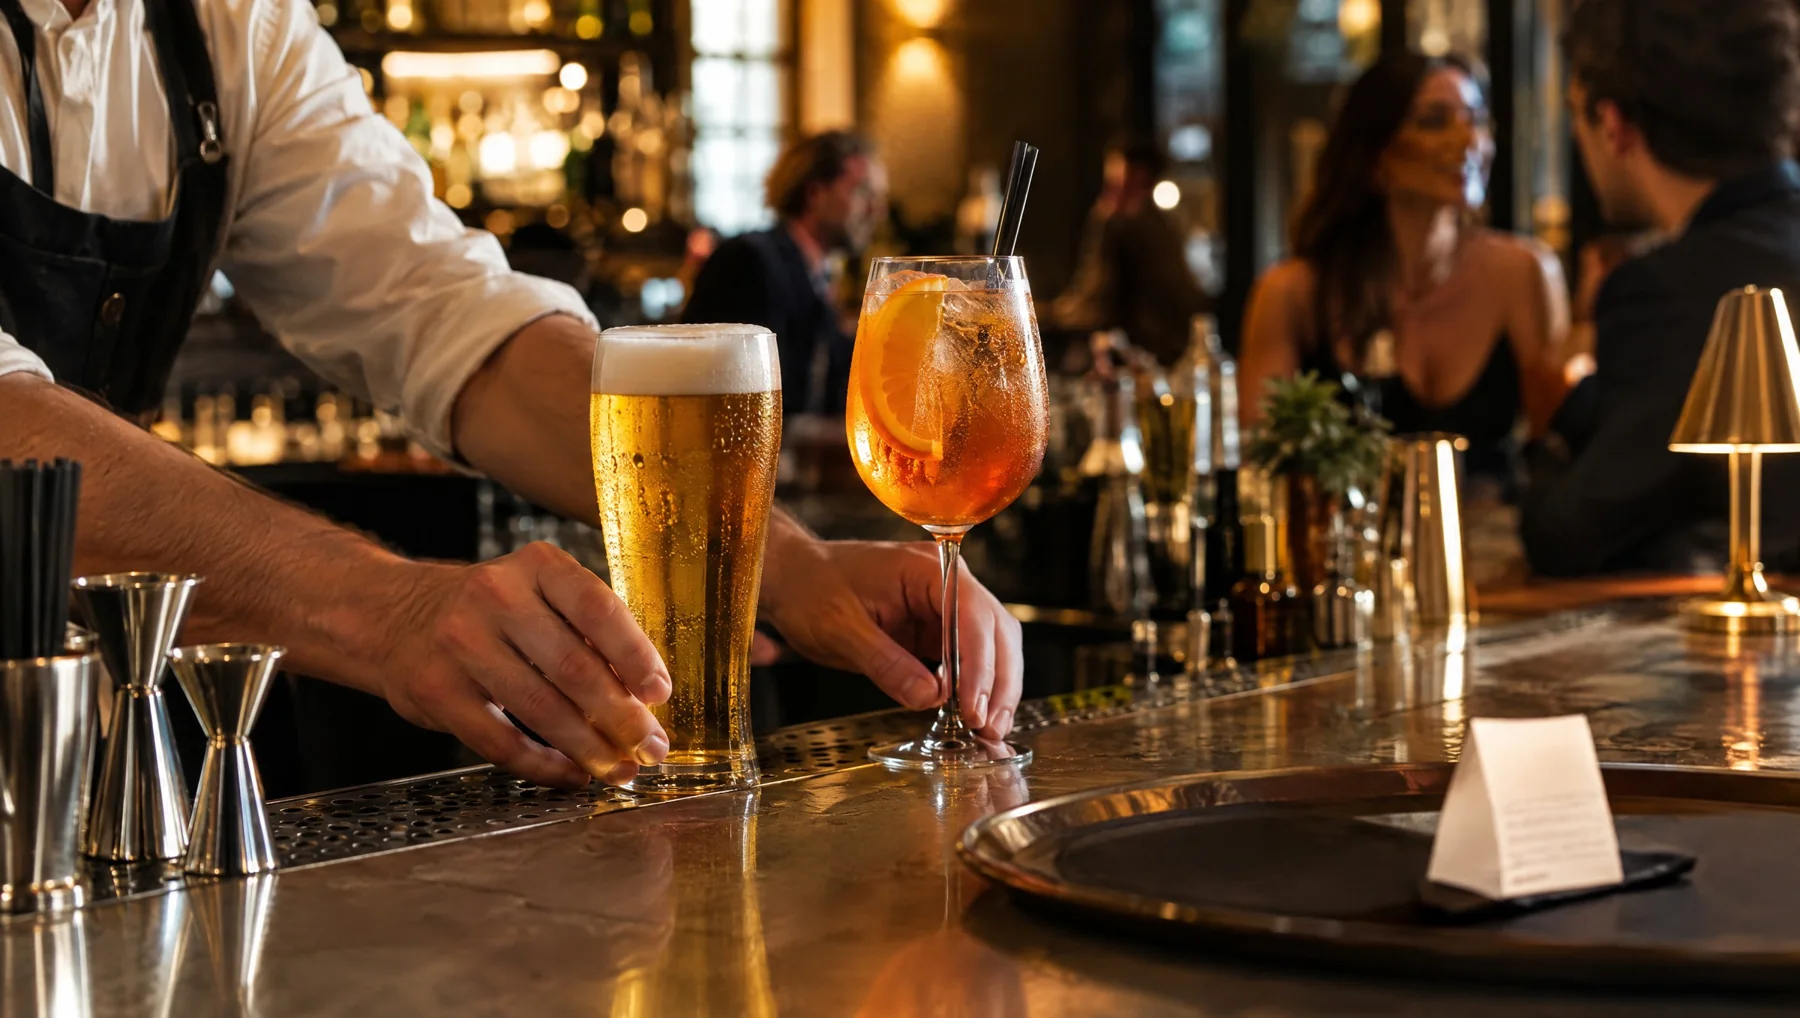
Bartender serving a beer and a cocktail to guests at a warmly lit bar

For food & beverage manufacturers

Your brands,
on the receipt.

Behind every order is a choice. Understand how your brands sell in bars, restaurants and hotels — across categories, occasions and the moments that matter to your customers.

Category & brand intelligenceRGM & sales teamsActivation measurement

See Fyre in action

Four questions beverage teams ask every month, answered from real receipts.

Chart drawn from a published Fyre analysis. Source below the chart.

Market share

Which brands are gaining share in bars and restaurants?

Fyre measures panel share by brand and owner, by market, region, city and venue type, every month. Comparable-venue trends help distinguish changes in sales from changes in panel composition.

Cocktails, share of alcoholic-drinks spend, H1 2026
  • France16.4%
  • Germany10.9%
  • Netherlands7.0%
  • United Kingdom6.4%

Source: The Aperitivo Hour, Fyre panel, about 33,000 venues.
Pricing

How does my price compare by city, venue type and competitor?

Fyre reads the price consumers actually paid for every serve. You see the price corridor of your category and where your brand sits in it, city by city.

Friends enjoying beer and cocktails together at a bar table
Put each serve in context.Explore formats, occasions and venue types alongside observed selling prices. Illustrative on-trade scene.

Distribution

Where does my brand sell, and where are the gaps?

A brand counts in a venue only when a receipt sold it. Explore distribution gaps by geography and venue type. Named outlet opportunities depend on the available scope and venue consent.

Share of beer-selling venues in London that sell each brewer
  • Brewer A20%
  • Brewer B41%
  • Brewer C52%

Source: UK panel, 14,070 venues, May to July 2026. Brewers anonymised.

Activation

Did the activation actually increase sales?

Activated venues are compared with matched control venues over the same period. The comparison helps estimate incremental sales performance by venue type.

Sales uplift of the Chocomel activation
  • All activated venues+7%
  • Daytime venues+12%

Source: FrieslandCampina, activation measured by Fyre.

How an activation is measured
  1. Activated venues
  2. Matched control venues
  3. Uplift

Illustration

Closer to the moment of choice

A drink. A table.
A moment for your brand.

A round with friends, an aperitif on a terrace, a drink with dinner. The on-trade is made of different occasions — and different opportunities to be chosen.

Consumption occasionsVenue typesCategory choices
Find the perspective for your team →
A group of friends sharing drinks and conversation on a sunlit restaurant terrace
Illustrative on-trade scene.

Explore Fyre for your team

Choose your team to see the questions Fyre answers for you.

Trade marketingSalesBrand activationRGM & pricingInsights & category

Trade marketing

Put trade spend where it moves sell-out.

  • Which venues should I activate first?
  • Which outlets matter most for my category?
  • Did my activation increase sales?
  • How did activated venues perform against a control group?

Fyre data Venue-level sell-out, and activation uplift against matched control venues.

Sales

Send the field team where the opportunity is.

  • Which outlets should my field team visit next?
  • Where does the category sell without my brand?
  • Which accounts have the biggest potential?
  • How is my brand performing by city and region?

Fyre data Distribution gaps ranked by potential, and your customer list matched to the panel.

Brand activation

Know which campaigns really sell.

  • Did the campaign drive incremental sales?
  • Which venue types responded best?
  • How did sales evolve during and after the campaign?
  • Which activations are worth scaling?

Fyre data Activation uplift against matched control venues, by venue type and period.

RGM & pricing

Price from what consumers actually paid.

  • What is the real price per serve by city and venue type?
  • Where is my brand priced above or below the market?
  • How does my price ladder compare with competitors?
  • Which formats and serve sizes sell where?

Fyre data Price paid per serve, price corridors and format mix, on one method across markets.

Insights & category

Read the category as it moves.

  • How is my category evolving, month by month?
  • Who is gaining share, and where?
  • Which cities and venue types drive growth?
  • What are consumers actually ordering, and when?

Fyre data Panel share, occasions by hour and day, and trends by city and venue type.

What you can see

Market

Category and brand performance by country, region, city and venue type.

Price

What consumers actually pay per serve, by outlet, format and city, against competitors.

Occasions

When your category is ordered, by hour and day, and what sits next to it on the ticket.

Distribution

Where your brand actually sells, and where the category sells without you.

Competition

Who is gaining share, in which venues and at which moment.

Activation

The estimated sell-out effect of a promotion or activation, against matched control venues.

Fyre in ten answers

What is Fyre?

An on-trade data intelligence company. Fyre turns the till receipts of bars, restaurants and hotels into sell-out data and benchmarks for food & beverage manufacturers.

What data does Fyre collect?

Item-level POS transactions: each receipt line with the product, quantity, price paid, time and venue type. No consumer identities.

Where does the data come from?

From POS software companies that partner with Fyre, for venues that consent. 150,000+ venues are connected across Europe. Reporting panels are selected through quality checks and vary by market, period and analysis.

How often is it updated?

Monthly by default, 3–4 days after the month closes. Weekly delivery is available.

What can a manufacturer measure?

Panel share, price per serve, distribution, rate of sale, occasions by hour and day, and the sell-out effect of activations against control venues.

How detailed is the geography?

Country, region, city and venue type. A figure is shown only when at least 5 venues contribute to it.

How does Fyre complement traditional panels?

Consumer panels ask a sample of people what they drank, and distributor data shows what was delivered. Fyre reads what was sold at the till, receipt by receipt, in the venues of its panel. It reports panel shares, not estimates of the total market.

Which markets are covered?

Germany, the United Kingdom, France and the Netherlands, with continuous history since 2023. Portugal, Spain and Italy are being built.

How is the data protected?

Brands see aggregates only. A venue is named to a brand only if that venue agreed.

How do I start?

Request a demo with one market and the questions you can't answer today. We discuss the relevant coverage and analysis scope with your team.

How Fyre measures the on-trade

From market measurement to outlet-level action

Fyre does not replace your market measurement. It adds what the till records: every sale in every measured venue, a few days after the month closes.

From market measurement to outlet-level action
Traditional market measurement Fyre transaction intelligence
Source Typically panels, audits, surveys, sell-in or distributor data Item-level POS transactions from consenting venues
Granularity Typically market, channel or region Venue, product line, hour and price paid
Frequency Varies, often monthly or quarterly Monthly, 3–4 days after the month closes; weekly on request
Outlet visibility Usually aggregated Venue level, anonymised; named only with the venue's consent
Pricing Often list or average prices The price actually paid, per serve
Activation measurement Usually outside the scope Uplift against matched control venues
Field sales Market context Venue lists ranked by potential, matched to your customers

Fyre reports shares of its measured panel, not estimates of the total market. It is built to sit alongside the measurement you already use.

Activation

Case: an activation measured at the till

Question
Did the Chocomel activation raise sell-out in the venues it reached?
Data
Receipts of the activated venues, read line by line in the Fyre panel.
Method
Fyre compares activated venues with matched control venues over the same period.
Result
Sales rose 7% across activated venues, and 12% in daytime venues.

Source: FrieslandCampina, activation measured by Fyre.

Two ways to use the same receipts

Describe the market

Aggregated and anonymised
  • Category, brand and format performance by market, region, city and venue type
  • Price, rate of sale, distribution and occasion, one method in every market
  • Competitors on the same receipts, with the same rules

Act on the market

Your customer list matched, with venue consent
  • Venues that sell the category but not your brand, ranked by potential
  • Price and assortment opportunities per outlet for your sales reps
  • Uplift measured against matched control venues

Four things Fyre does with a receipt

Readthe market

What sells, where, when, at what price and against whom.

Targetthe outlets

Which venues to win, defend or reprice, ranked by measured potential.

Activatethe venue

Offers and challenges delivered to the venue's till or the owner's phone.

Provethe effect

Estimated activation uplift against matched control venues, by venue type.

Choose your starting point

Your questions.
The right Fyre solution.

Explore the market, shape your commercial priorities or measure an activation with the view that fits your team.

Market & category intelligence

Market Pulse

Read food and beverage trends, category performance, consumption occasions and observed selling prices.

Explore Market Pulse →
Revenue growth management

On-Trade Suite

Explore panel share, growth, distribution and portfolio priorities. Go further into your business questions with FLAM.

Explore On-Trade Suite →
Activation performance

Activation Monitor

Compare activated venues with matched controls and assess sell-out uplift to inform your next investment.

Explore Activation Monitor →

Data for your workflow

Discuss delivery to BigQuery, an API or dated files, with documented definitions and an agreed scope.

Your customer context

Explore how your outlet list can be matched to the panel, with the appropriate venue permissions, to inform your commercial priorities.

Coverage

Venues measured over July 2025 to June 2026, after quality checks. Portugal, Spain and Italy are being built.

Germany15,000+
United Kingdom11,000+
France7,000+
Netherlands6,000+

The panel is mostly independent venues; major managed chains are not covered.

Let’s talk about your brand

Bring your market.
Bring your next question.

Tell us which category, market or activation matters to you. We’ll explore the relevant views and available coverage together.

Let's talk

How we
can help ?

Want to learn more about Fyre, explore a partnership or ask us a question? We’d love to hear from you.

Fill in the form and our team will get back to you within 48 hours.

bottom of page