
What is my panel share, market by market?
Track your share of identified sales on a comparable outlet panel, with monthly updates. Panel shares describe the measured scope, not the total market.
Share · category trends · markets

Fyre On-Trade Suite · Revenue Growth Management
Turn real sales from bars, restaurants and hotels into clearer revenue decisions. Explore panel share, pricing, occasions and activation performance in one suite built for RGM and sales teams.
7 European markets · Monthly data refresh · Access for your whole team
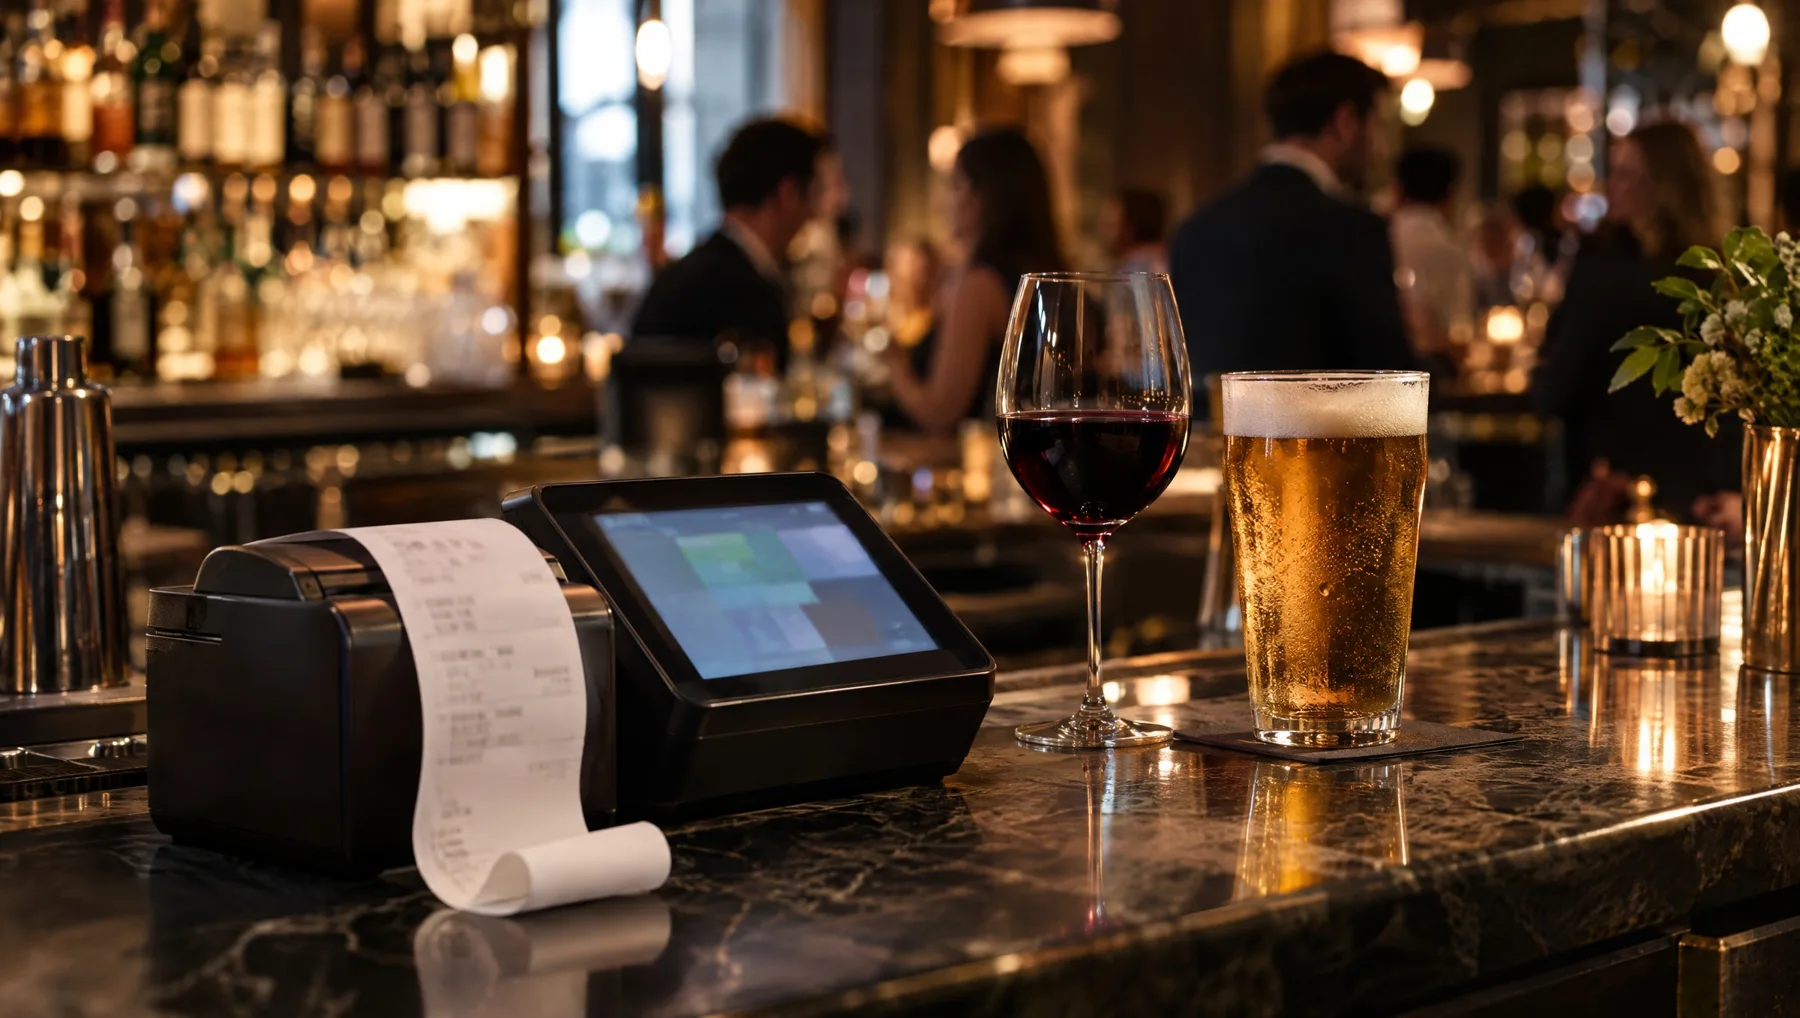
One ticket connects the occasion, product, serve size, price and purchase basket.
Closer to the moment of purchase
A category total is a starting point. To act on it, your team needs to understand the occasion, format, price and basket behind the sale.
On-Trade Suite brings those views together using receipt-level POS data, so revenue, marketing and sales teams can work from a shared picture.

12 modules. One connected view.
From your market position to your next sales priorities, explore the questions the suite helps your team answer.
12 modules shown.
Track your share of identified sales on a comparable outlet panel, with monthly updates. Panel shares describe the measured scope, not the total market.
Break growth down month by month to understand the contribution of price, volume and mix alongside category performance.
Explore demand by day and daypart using receipt timestamps. Identify the occasions that matter for your category and your next activation.
Analyse which products appear together on actual receipts, revealing complementary purchases and patterns within the basket.
Compare brand owners by market, region and outlet type using share, distribution, rate of sale and price indices.
Explore price distributions and your position versus the category median, with pack and serve-size comparisons.
Compare the value mix across packs and serves. Find where the category generates value and your portfolio has gaps.
Prioritise headroom by region and outlet type, bringing category value, competitive presence and your own share into the decision.
Estimate activation uplift using difference-in-differences against matched control cells, with the comparison design shaping interpretation.
Explore seasonal projections with uncertainty bands, backtested against historical performance. Forecasts remain estimates.
Read confidence grades linked to sample size and coverage. Cells with insufficient data are suppressed.
Bring ranked headlines to the team through a weekly digest and export module views as board-pack PDFs.
Inside On-Trade Suite
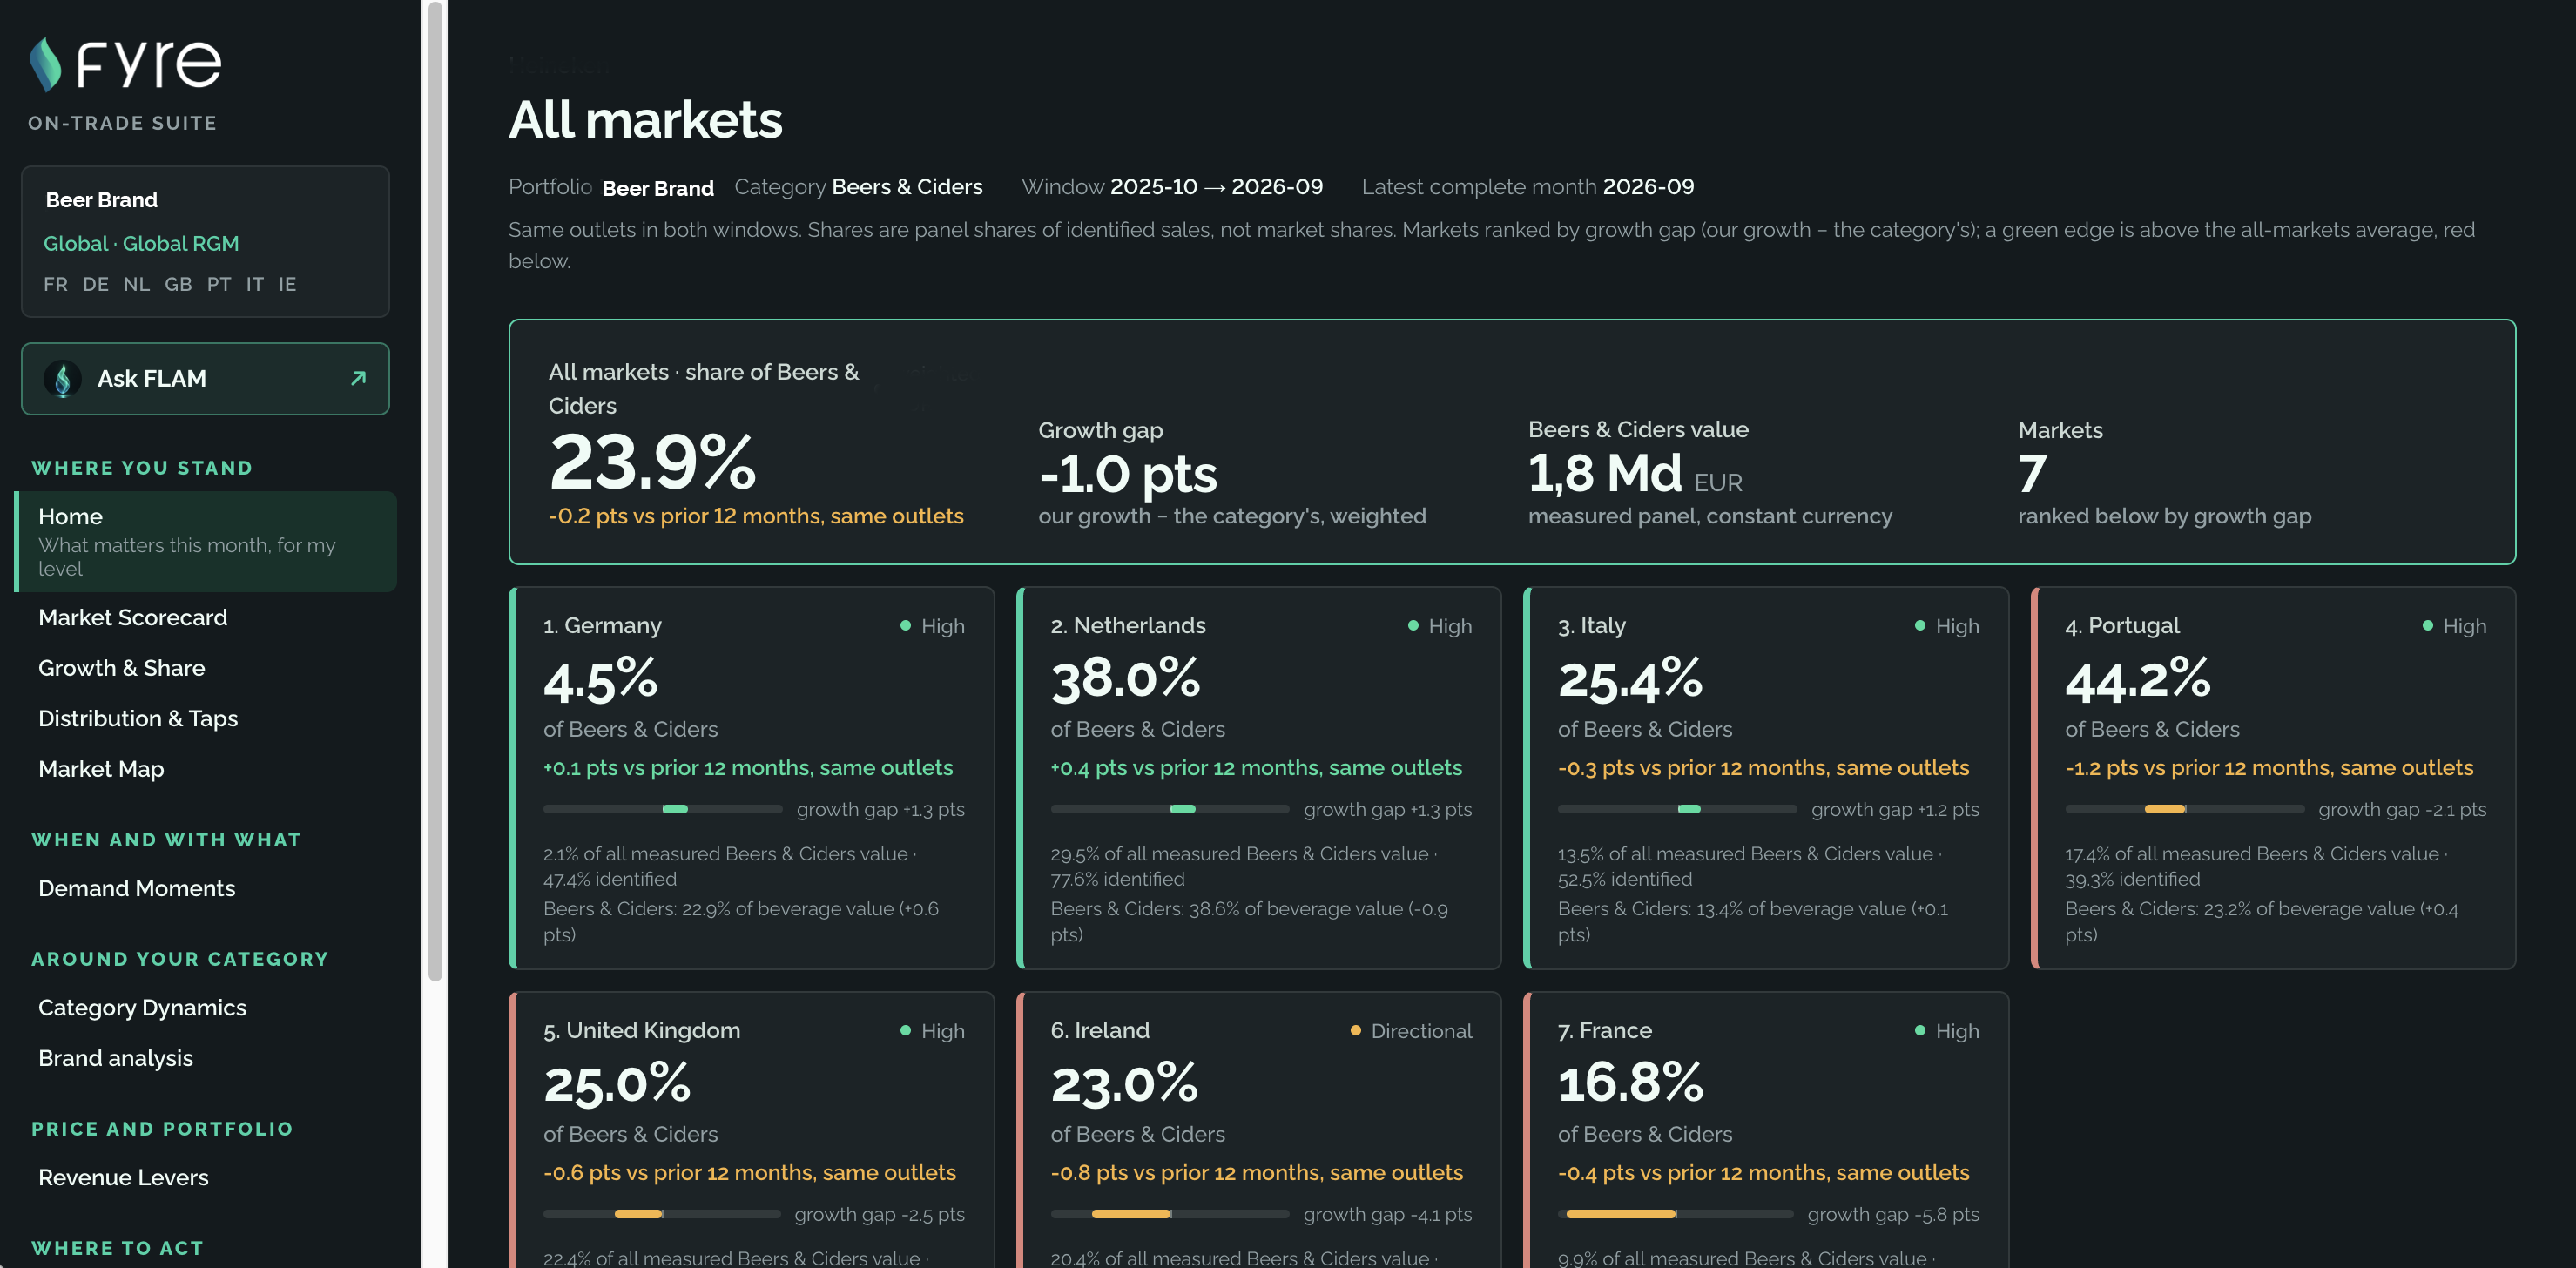
Compare your position across markets, read the growth gap versus your category and keep confidence levels in view. Start from the overview, then explore the commercial question behind it.
 Enlarge dashboard ↗
Compare panel share and growth against your category across the markets in your portfolio.
Review the measurement window, comparable outlets, classification coverage and confidence indicators alongside the figures.
Move into market scorecards, growth, distribution, occasions and revenue levers — or open Ask FLAM.
Meet FLAM · Your conversational assistant
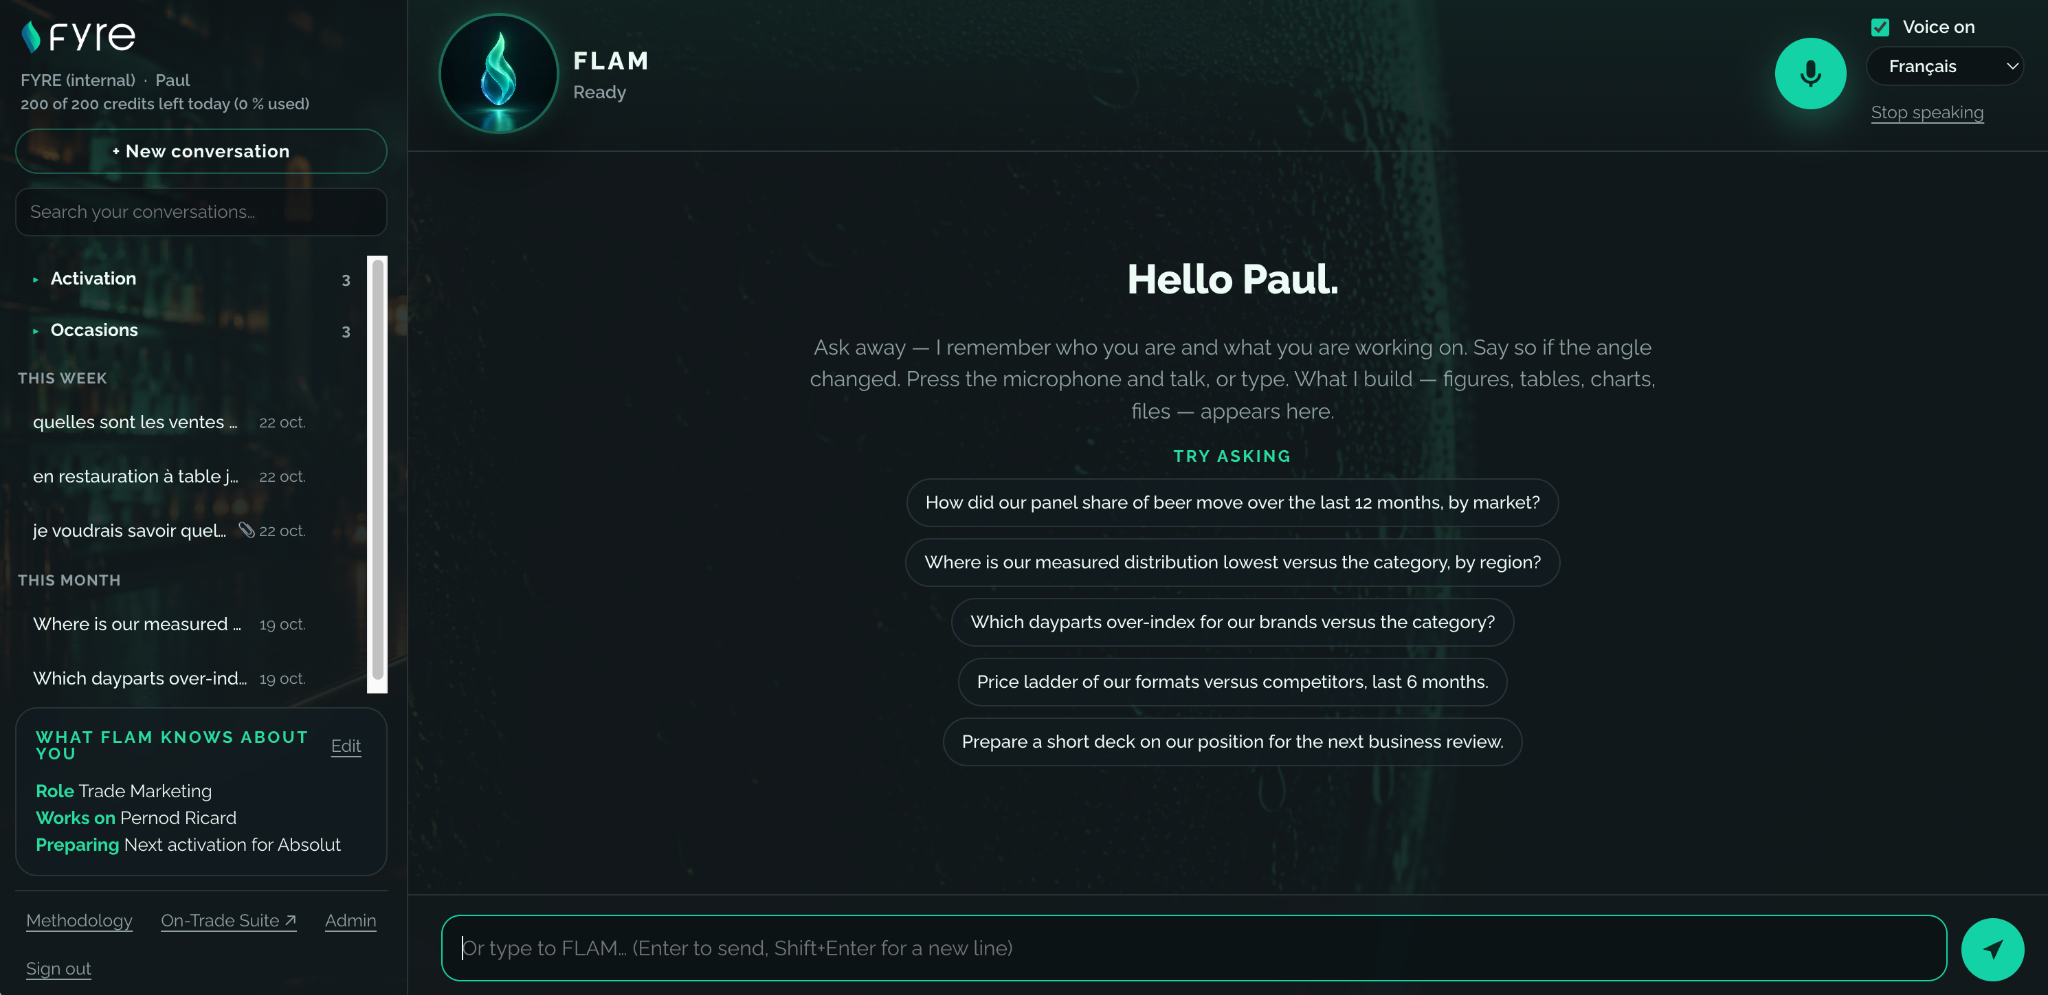
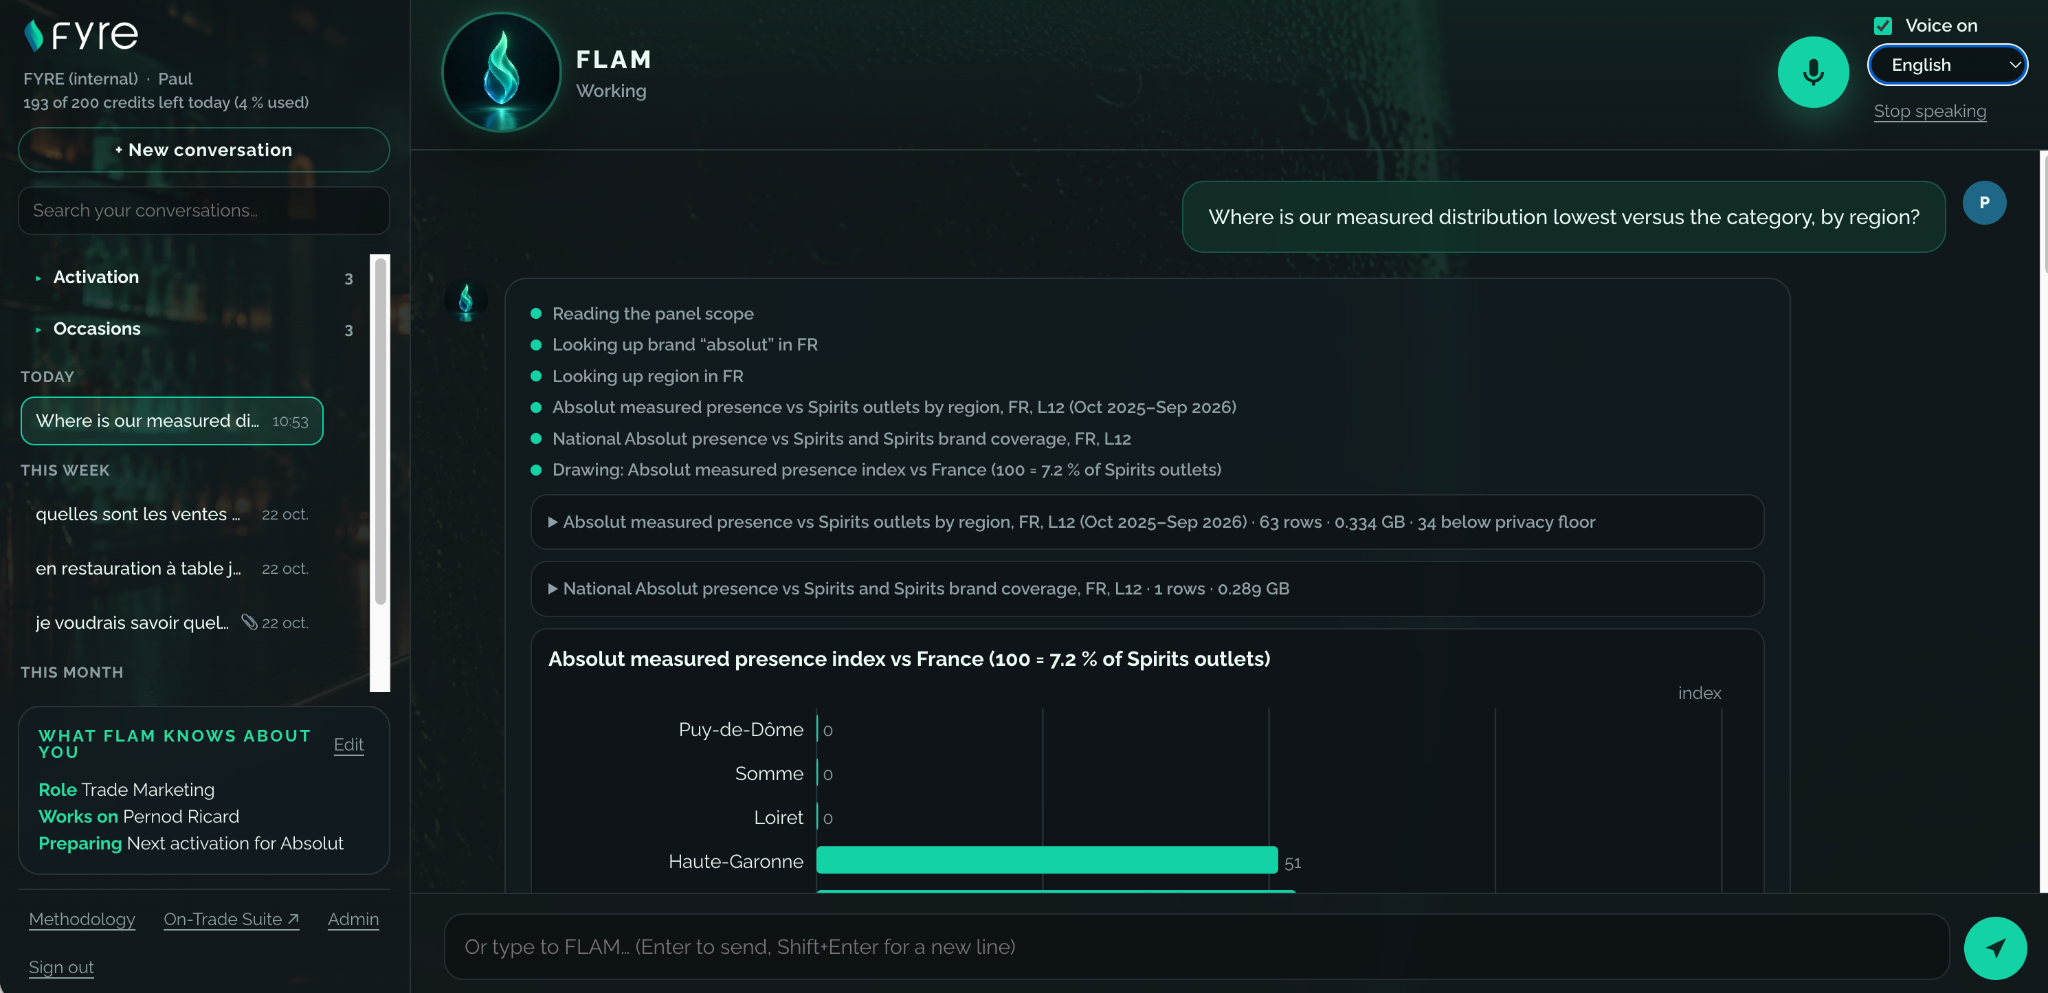
FLAM gives your team a conversational way to explore on-trade data. Ask about your brand, category or region, then follow the analysis through figures, tables and charts. Your role and current priorities help frame the conversation.
 Enlarge FLAM ↗
 Enlarge the analysis ↗
“How did our panel share move over the last 12 months, by market?”
“Where is our measured distribution lowest versus the category, by region?”
“Which dayparts over-index for our brands versus the category?”
“How do our format prices compare with competitors?”
Explore your business questions with the team and see how FLAM fits into your On-Trade Suite workflow.
See FLAM in a demo ↗The panel behind the suite
Compare markets with a clearly defined measurement period and panel scope.
Source: On-Trade Suite presentation, live build covering July 2025–June 2026. These figures describe this measured panel, not Fyre’s entire connected network. Panel depth varies by market; confidence grades reflect sample size and coverage.
From source to decision
POS receipts capture the item, quantity, price and timestamp at line level, providing a sell-out source for analysis.
The data engine deduplicates catalogues and classifies lines by beverage category and brand owner using reference quality rules.
Aggregated views carry confidence grades. Insufficient samples are suppressed and outlet identities are not exposed in the suite.
Built for the whole team
Coverage built around your business
Choose the market coverage that fits your commercial priorities. Explore the suite with our team and define the scope for your business.
FOCUS
Start with the market that matters most and build a shared view of performance.
Discuss your market ↗CONNECT
Connect your core European markets through one analysis framework.
Discuss your coverage ↗EXPLORE
Explore the full measured footprint and put your portfolio in a broader context.
Discover the full suite ↗Before your demo
On-Trade Suite brings together RGM and sales analyses: portfolio position, growth, occasions, pricing, competitive context and activation impact. The dashboard above is the On-Trade Suite All markets view.
Use Ask FLAM to explore a commercial question in a conversation, through voice or text. Explore contextual questions, figures, tables and charts. Ask the team about access and the scope available for your account.
No. In this dashboard, shares are calculated from identified sales within the measured panel. Interpret them with the displayed scope, period, classification coverage and confidence level.
The underlying panel is refreshed monthly. The suite also provides a weekly digest of ranked headlines; this does not imply a weekly refresh of the source data.
The source is measured POS sell-out. Outputs such as trajectories and activation impact use projections or analytical estimates. Confidence, study design and historical context matter when interpreting them.
The suite provides privacy-safe aggregates. Outlet identity is not exposed and cells with insufficient samples are suppressed.
The team will open the product on your market and discuss your categories, brands and commercial questions. The call is designed to take around 30 minutes.
Your market. Your questions.
Bring a market, a category and the question you need to answer. Explore On-Trade Suite with our team in a 30-minute demo.
On smaller screens, scroll horizontally to explore the full image.
Want to learn more about Fyre, explore a partnership or ask us a question? We’d love to hear from you.
Fill in the form and our team will get back to you within 48 hours.