top of page
Fyre   /   Market Pulse

Market Pulse · Food & beverage intelligence

Know what HoReCa
really eats
and drinks.

Turn real transactions from restaurants, bars, hotels and bakeries into a clearer view of your market. Understand what is changing, explore your categories and identify where to grow.

Food & beveragesReceipt-level dataLike-for-like comparisons
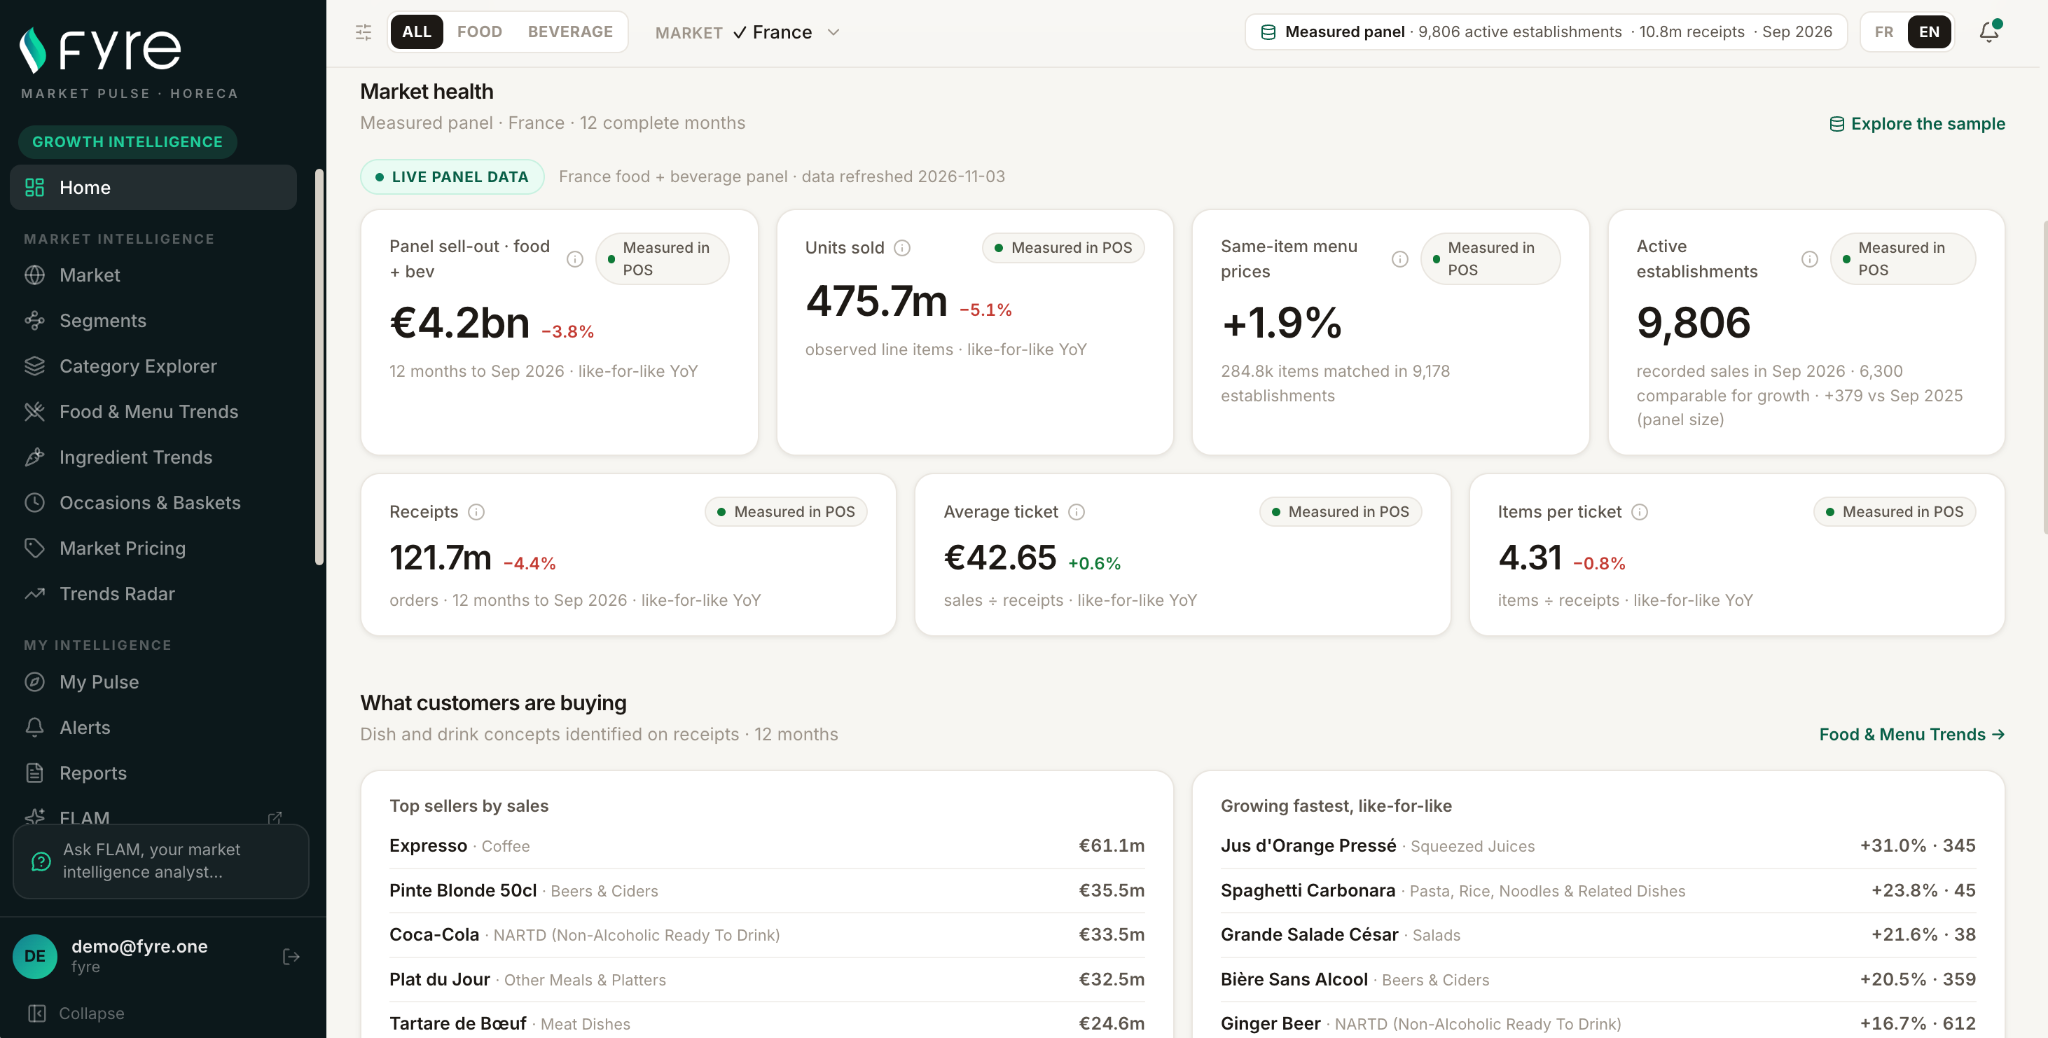
Market healthView full size Full English Market health dashboard for France, showing sales, menu prices, receipt metrics and best-selling products
Market Pulse · France · 12 months to September 2026
For everyone selling into HoReCa.Manufacturers & brandsDistributors & insight teamsOperators & partners

Closer to actual consumption

Understand the market
behind the menu.

What are people ordering? Which categories are growing? Where are prices moving? Market Pulse connects market, segment and category views to the sales recorded at the till.

Explore food and beverages together, from coffee and beer to bakery, dairy and the dishes that shape ingredient demand.

Warm restaurant dining room during service
On-trade atmosphere · illustrative image.

Inside the platform

One market.
More ways to understand it.

Start with sales across the panel, then follow the categories that matter to your team. These two views show how that works in France.

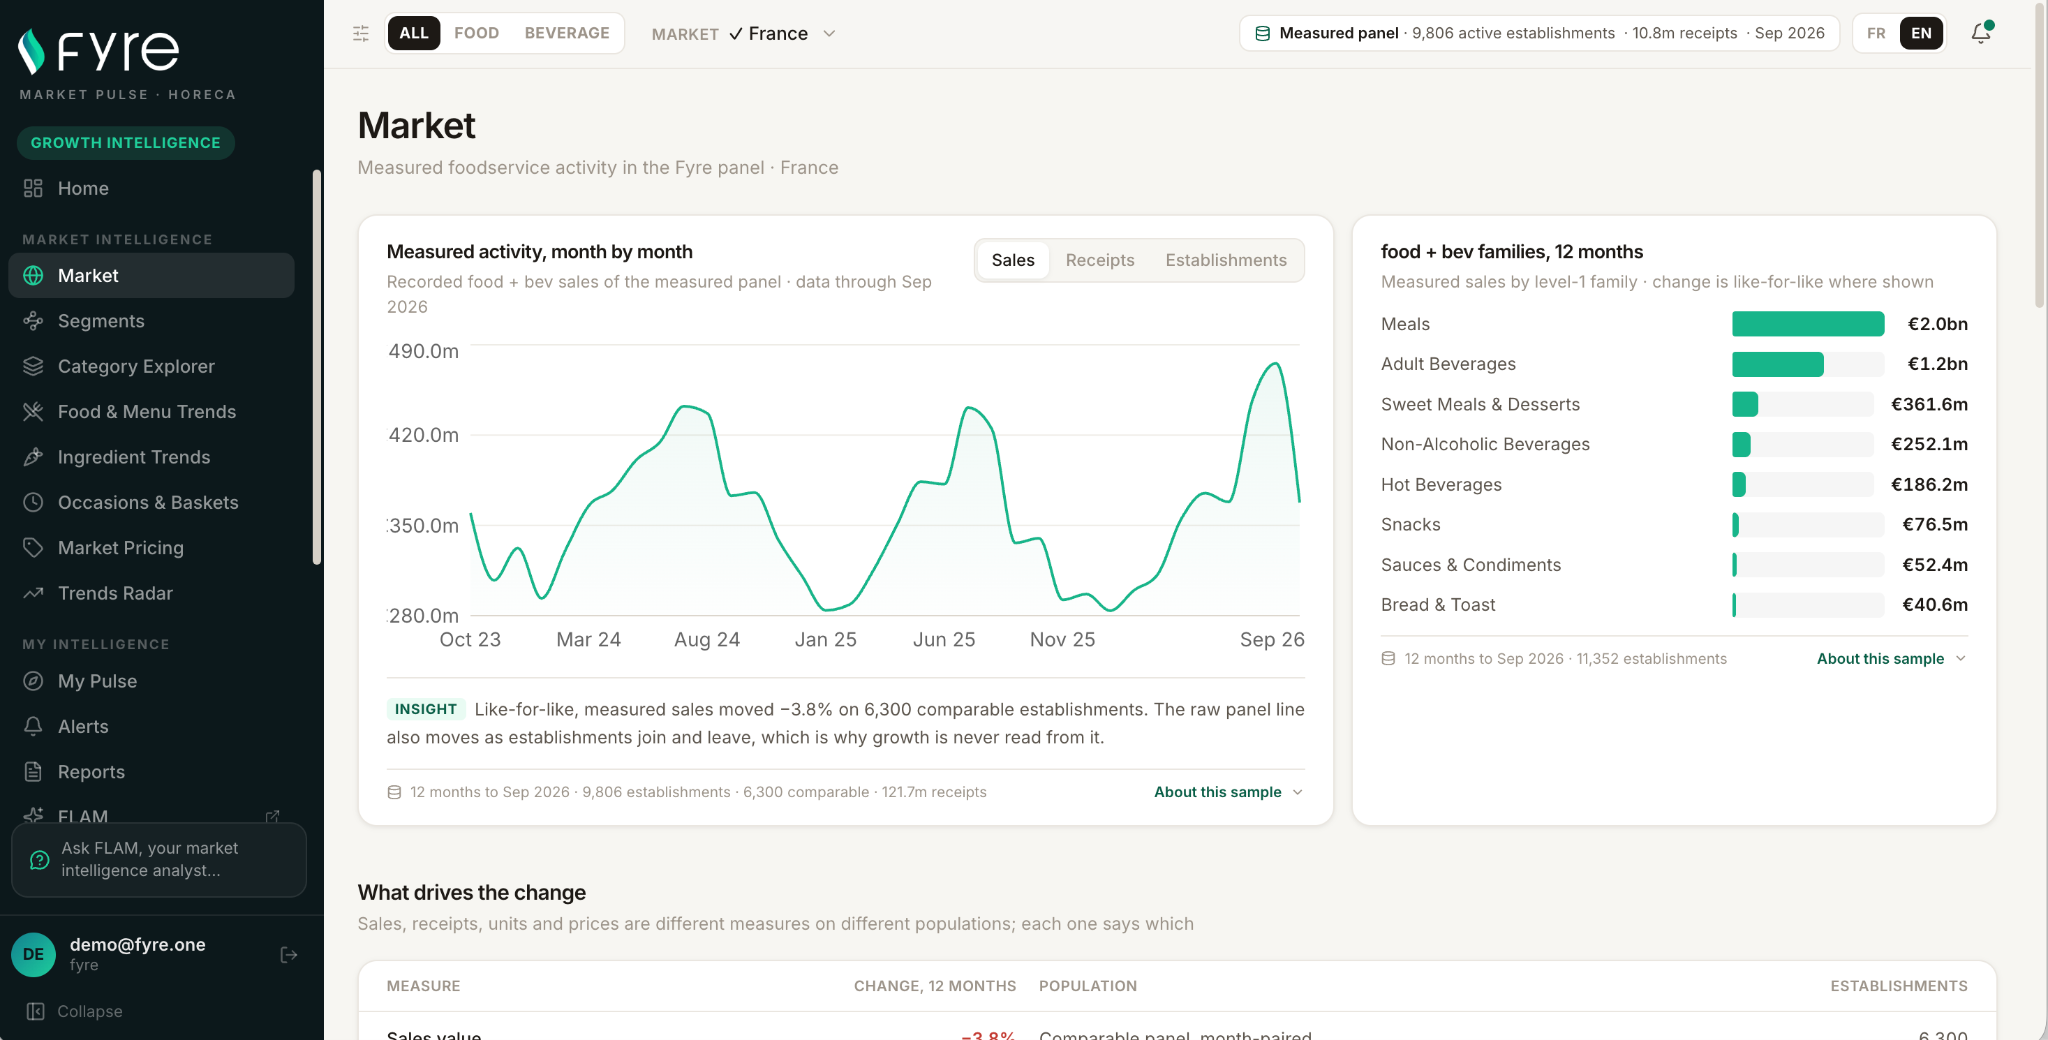
Market

How is the market trading?

Track monthly sales, receipts and active establishments. Compare food and drink families over 12 months, and use the matched panel to read growth.

Market view with monthly sales and a 12-month breakdown by food and beverage family in France
France · Data through September 2026 Enlarge Market view ↗

My Pulse

What changed in my categories?

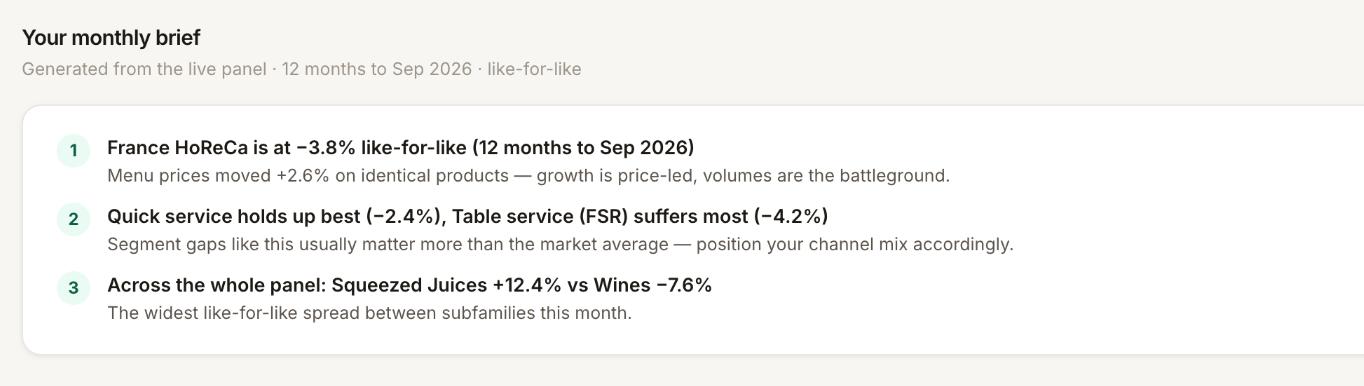
Choose up to three categories to shape your home dashboard, monthly brief and email digest. See which segments held up and which categories gained pace.

My Pulse monthly brief showing changes in French foodservice sales by segment and category
France · Monthly brief excerpt, September 2026 Enlarge My Pulse view ↗
01 / MARKET & SEGMENTS

Compare sales across venue types.

Track sales, receipts and units, then compare the performance of quick service and table service on a like-for-like basis.

02 / CATEGORY EXPLORER

Find the categories behind growth.

Move from a food or beverage family to the products behind it. See which categories account for the most sales in your selected market.

03 / FOOD & MENU TRENDS · INGREDIENT TRENDS

See what customers are ordering.

Identify best-selling dishes and drinks from receipt lines. Explore the ingredients behind dishes, with modelled volumes labelled as estimates.

04 / MARKET PRICING

Track prices for the same items.

Compare menu prices for matched items in the same establishments to see how prices change over time.

05 / OCCASIONS & BASKETS

Look inside the order.

Explore purchase occasions and basket composition. Compare average spend and items per receipt alongside sales volume.

06 / TRENDS RADAR

Spot changes in momentum.

See which subfamilies are gaining or losing pace relative to their own 12-month trend.

07 / MY PULSE & ALERTS

Keep your categories in view.

Choose up to three focus categories for your dashboard, monthly brief and email digest. Use Alerts to follow the indicators that matter to your team.

08 / FLAM

Ask FLAM in your own words.

Ask about a category, market or region, then explore the figures, tables and charts behind the answer.

Meet FLAM

Start with
a question.

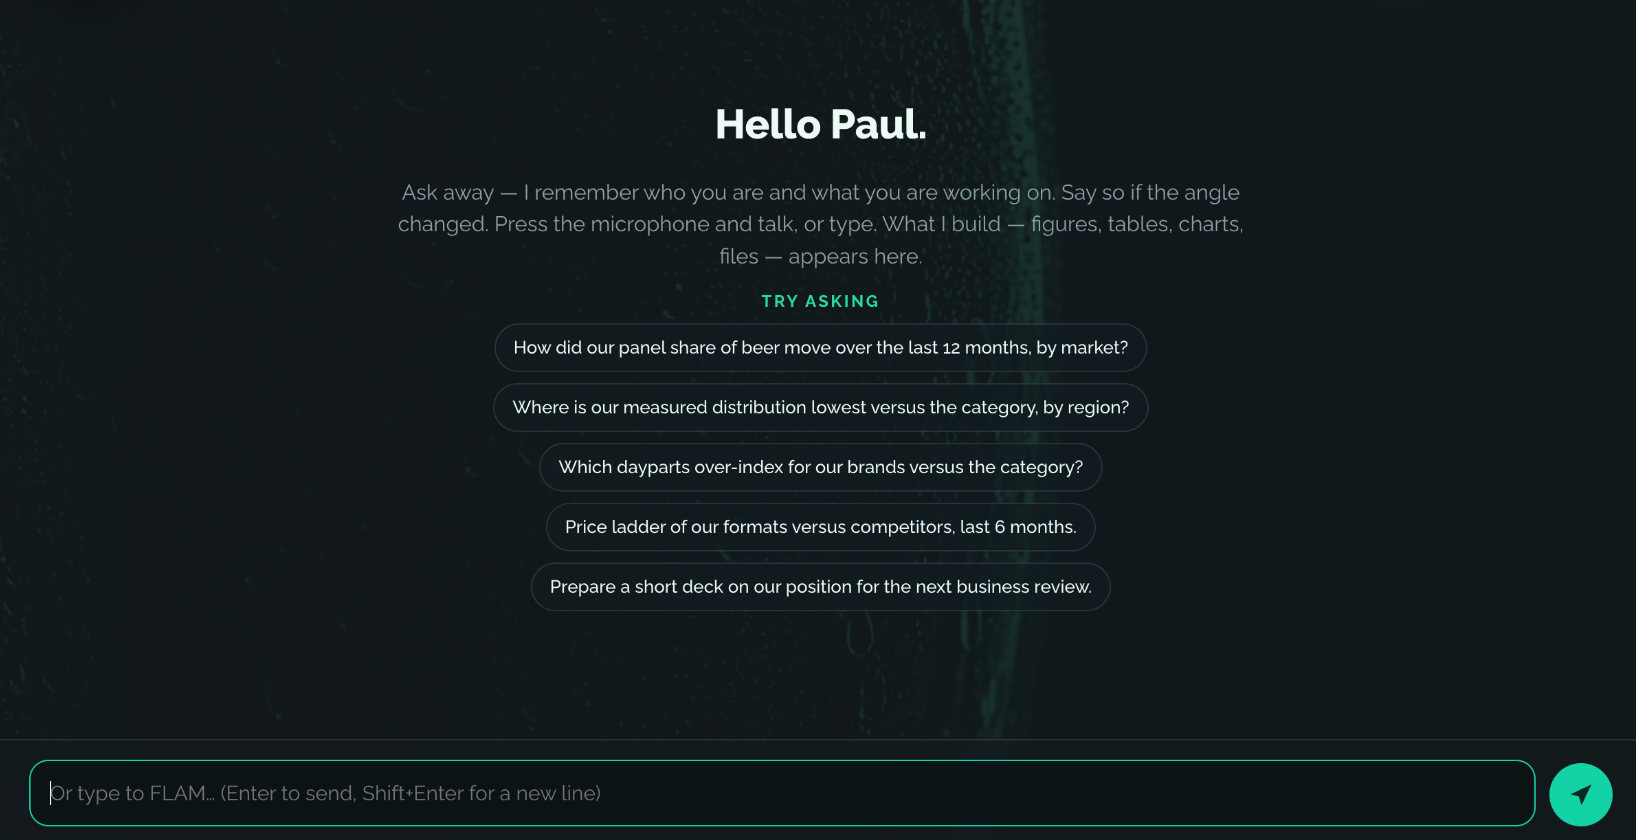
Type or say a question such as “How have coffee prices changed in France?” FLAM draws on the panel data to answer. Follow up by asking how the trend varies by region.

FLAM welcome screen with suggested questions and a text input
FLAM welcome screen. Choose a suggested question or ask your own.

Know where each number comes from

Observed. Classified. Estimated.
Clearly distinguished.

Observed

Values recorded directly in POS transactions, such as sales, prices and quantities.

Classified

Products assigned to the Fyre taxonomy, making category and dish-level analysis possible.

Estimated

Ingredient volumes inferred from recorded dishes using recipe models. These figures are labelled as estimates.

A consistent basis for comparison

Compare performance.
Keep the scope in view.

Venues join and leave a panel over time. Like-for-like analysis helps distinguish changes in trading performance from changes in the panel itself.

  • Matched outlets: compare establishments present in both years, matched month by month.
  • Outlier screening: exclude revenue ratios outside the stated ⅓–3× range.
  • Complete periods: series stop at the last complete month.
  • Visible scope: show the analysis perimeter and label modelled estimates.

France · Measured food & beverage panel

The French panel
in numbers.

€4.2bnfood and beverage sales in the 12 months to September 2026
121.7Mreceipts over the same 12 months
9,806establishments recording sales in September 2026
6,300comparable establishments for like-for-like growth

Source: Market Pulse, France, 12 months to September 2026. Sales fell 3.8% year on year on a like-for-like basis. The monthly active count and the matched group used to measure growth have different scopes.

Choose your starting point

A focused report.
Or an ongoing market view.

Market reports

A category question
to answer now?

Explore France reports covering categories such as bakery, dairy, beer, coffee, wine, spirits and soft drinks. Reports are written in French. Discuss the category and scope relevant to your business with our team.
Platform access

A market to follow
throughout the year?

Start with market performance, then explore deeper category, pricing and commercial intelligence. Discover the views that can help your team answer its next business question.

POS terminal and receipt on a bar counter
Service context · illustrative image.

For venue operators

Your segment.
Your region.
Your market context.

Operator Pulse helps restaurants, cafés, bars, bakeries and hotels compare their segment and region, explore observed price ranges and understand consumption patterns.

Aggregated views only: individual venues are not shown or identifiable.

Built around your market

From the producer
to the point of service.

Food manufacturersDairies & cheesemakersBrewersCoffee roastersSoft drinks & watersWines & spiritsDistributorsKitchen equipmentPOS & fintechRestaurants & chains

Before you explore

A few useful distinctions.

Does Market Pulse cover food as well as beverages?

Yes. The presentation covers food and beverage intelligence, including categories, dishes and ingredient estimates. Available detail depends on classification coverage, market and the scope available to your team.

Do the panel figures represent the entire market?

No. They describe the observed Fyre panel. Each analysis should be read with its period, geographical scope and coverage.

Are ingredient volumes directly measured?

No. Recipe models convert recorded dishes into estimated ingredient volumes. These outputs are labelled as modelled estimates.

Can I explore a specific category through a report?

Yes. France reports cover individual food and beverage categories. Tell the team which category and business question you want to explore, and discuss the most relevant report.

How do we choose the right scope for our team?

Start with the question you need to answer: market performance, growth segments, category drivers or commercial priorities. During a demo, the team can help identify the relevant markets, categories and capabilities.

Your next market question

Bring the question.
Explore the evidence.

Discover the market and category views most relevant to your business with the Fyre team.

Book a demo ↗

Let's talk

How we
can help ?

Want to learn more about Fyre, explore a partnership or ask us a question? We’d love to hear from you.

Fill in the form and our team will get back to you within 48 hours.

bottom of page