ON-TRADE DATA INTELLIGENCE
We measure what people eat & drink in bars and restaurants
Fyre connects to POS systems across 140,000+ bars, restaurants and hotels in Europe. We transform 150 million+ receipts every month into the market intelligence F&B brands need to win in the on-trade, from market strategy to outlet-level profitability.
140 000+
Connected outlets
150M+
Receipts / month
99%
Classification accuracy
10+
Active markets
WE TRACK THE WORLD'S LEADING COMPANIES


THE PROBLEM
The on-trade is a
data blind spot
In retail, brands have had access to scan data for decades.
In the on-trade, bars, restaurants, hotels they've been flying blind.
No reliable sell-out data. No visibility on what's actually being poured. Decisions worth millions still driven by gut feeling, outdated surveys and fragmented reports.
What's our real market share in on-trade?
“We don't know exactly."
Did that activation drive sell-out?
“We think so, but can't prove it."
Which outlets should we prioritize?
“The field team has a feeling."
How are competitors priced?
“We have some anecdotal data."
HOW IT WORKS
From raw receipts
to market intelligence
STEP 01
Connect
Direct POS integrations across 140K+ outlets. No hardware. No surveys. Always-on data pipeline.
STEP 02
Classify
AI-powered product matching. Every item categorized by product, brand and manufacturer at 99%+ accuracy.
STEP 03
Structure
Raw receipts become structured market data. Standardized taxonomy across markets and outlet types.
STEP 04
Deliver
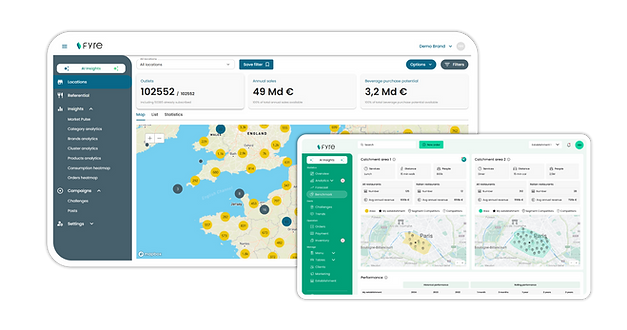
Real-time dashboards, API access and custom analytics. Sell-out intelligence at your fingertips.

THE ECOSYSTEM
One intelligence layer.
Three sides of value.
Fyre sits at the center of the on-trade ecosystem. More POS partners mean more outlets.
More outlets mean better benchmarks. Better benchmarks mean more value for everyone.
INTELLIGENCE LAYER
Brands
Market share & competitive intelligence
Activation measurement & ROI
Outlet-level sell-out analytics
POS Partners
New recurring revenue streams
Higher merchant retention & ARPU
Data-driven product differentiation
Operators
Benchmark vs. similar venues
Optimize margins & pricing
AI-powered menu recommendations
More POS partners → More outlets → Better benchmarks → More value for all → More POS partners

PLATFORM
Four modules.
One intelligence layer.
Market Intelligence
Category-level sell-out across your entire market.
Volume, value, trends — updated continuously.
Competitive Benchmarking
Brand vs. brand performance at outlet level. Market share, distribution, velocity — all from real transactions.
Activation Measurement
Measure the actual sell-out lift of every activation, promo or listing change with causal attribution.
Outlet Intelligence
Score, segment and profile every connected outlet. Volume potential, category mix, brand affinities.
RESULTS
What our clients achieve

+12%
PRICING GAP IDENTIFIED
"Fyre gave us visibility into on-trade sell-out we simply didn't have. We identified a 12% pricing gap vs. our main competitor within 2 weeks."
Global Beer Manufacturer
3x
THAN TRADITIONAL METHODS
"We used Fyre to measure a cocktail activation across 3 markets. For the first time, we could prove sell-out uplift to our board."
International Spirit Brand
+18%
ARPU INCREASE FOR POS PARTNERS
"After launching Fyre-powered intelligence modules, our merchants engage daily with benchmarking data. Churn dropped and ARPU increased within one quarter."
European POS Partner

HOW WE'RE DIFFERENT
Not a replacement
for panel data.
A new layer of truth.
If you work with NielsenIQ, CGA or Circana, Fyre complements what you already have with something they struggle to provide at scale: real sell-out data from individual on-trade outlets.
FYRE
Direct POS transactions
Individual outlet level
Continuous / real-time
140K+ connected outlets
Causal sell-out attribution
Scales with data
Data source
Granularity
Frequency
Coverage
Activation measurment
Cost efficiency
TRADITIONAL PANELS
Surveys & sampling
Aggregated regions
Monthly or quarterly
Statistical extrapolation
Pre/post estimates
High manual overhead