
Build a relevant
comparison.
FyreMatch pairs activated venues with control venues based on region, concept and customer profile, creating a benchmark for each scenario.
Fyre · Activation Monitor
Measure what your on-trade activations change in actual sales. Compare activated venues with matched control groups, then see where to scale, monitor, repair or reduce your investment.
For trade marketing, brand and commercial teams.
The measurement framework
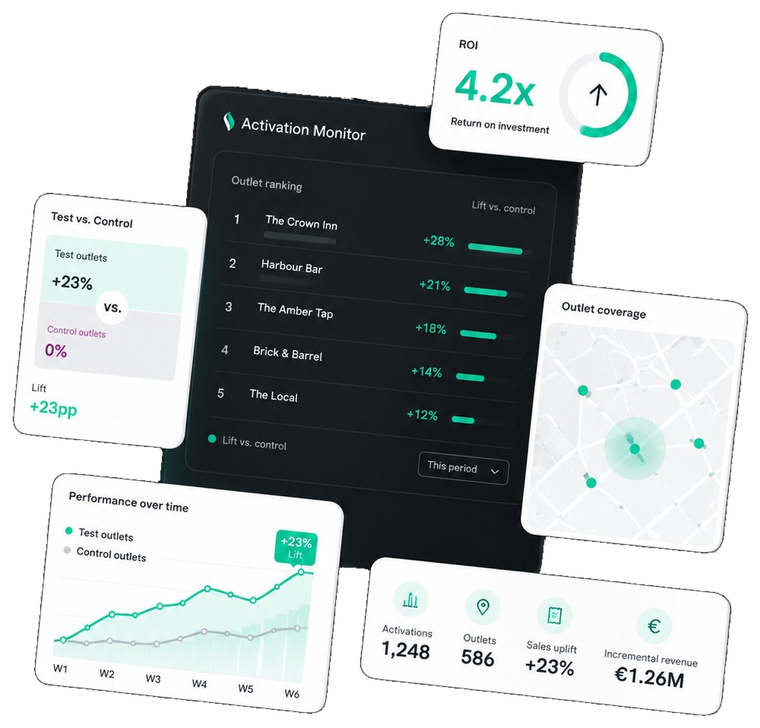
A sales increase alone does not tell you how much an activation contributed. Activation Monitor combines POS data, historical baselines and comparable venues to estimate its incremental impact.
FyreMatch pairs activated venues with control venues based on region, concept and customer profile, creating a benchmark for each scenario.
Analyse receipt-level sell-out, incidence and product rotation against the control group and historical baseline.
Compare modelled incremental value with activation cost. Use the ROI index to identify where to scale, monitor, repair or reduce.
What you can measure
The difference in sales performance versus matched control venues.
The share of transactions containing your brand, beyond volume alone.
How quickly products sell during an activation compared with the baseline.
Performance relative to comparable venues by region and concept.
Explore the decision framework
Compare different activation types in one view. Filter this illustrative example to see how the ROI index translates into an action.
| Activation | Sell-out uplift | Incidence | ROI index | Verdict |
|---|---|---|---|---|
| Branded glasswarePremium bars | +14.2% | +6.1 pp | 4.1 | SCALE |
| Tap badge & fontDraft visibility | +9.8% | +4.0 pp | 3.4 | SCALE |
| Sampling weekendsField activation | +11.0% | +5.4 pp | 1.9 | MONITOR |
| Bottle cooler facingFridge placement | +4.1% | +1.8 pp | 1.1 | REPAIR |
| Staff incentiveTrade engagement | +6.8% | +2.9 pp | 0.7 | REDUCE |
5 activations shown. Illustrative sample values from the Activation Monitor presentation. Not client results.
Prioritise further investment.
Maintain and track performance.
Review execution before expanding.
Reassess spend or redesign the activation.
How to read the index: modelled incremental value versus the matched control group, divided by activation cost. Results depend on the comparison design, available data and cost assumptions.
Built for on-trade decisions
Choose the commercial question first. Then define an activation scenario and the comparison that will help answer it.
Discuss your activation ↗Study setup
The standard study setup combines a test group, a matched control group and historical data.
Data granularity: hourly and daily. Refresh: monthly in the standard setup. Study scope and data availability are agreed for your activation.
Define your study
One test group corresponds to one activation scenario. Discuss the scope and measurement design that fit your objectives.
FyreMatch benchmarking, activation performance measurement, dashboards and consolidated reports bring your study together. Venue-level data access is optional and requires venue owner consent.
A few practical questions
The analysis compares activated venues with matched control venues and a historical baseline. This helps estimate incremental performance, rather than attributing every change in sales to the activation.
The standard setup specifies hourly and daily data with a monthly refresh. The refresh schedule for your project should be agreed when defining its scope.
No. The dashboard visual and ranking table use illustrative sample values from the Activation Monitor presentation to explain the framework. They do not predict the results of a future activation.
Venue-level data access is available as an option, with the venue owner's consent. The required scope can be discussed during your demo.
Your next activation
Book a 30-minute call to map your activation scenarios to test groups and walk through the dashboards with our team.
Want to learn more about Fyre, explore a partnership or ask us a question? We’d love to hear from you.
Fill in the form and our team will get back to you within 48 hours.