

ON-TRADE INTELLIGENCE PLATFORM
Eight proven
ways FYRE
drives growth
From pricing to performance — turning live on-trade receipt data into actionable intelligence that helps brands and venues grow together. Across Europe. In real time. At outlet level.
140 000+
Connected outlets
150M+
Receipts / month
10+
Active markets

01 — THE FRAMEWORK
Eight commercial levers,
one harmonized data source.
Each lever solves a question your commercial teams keep asking. Together they form a complete operating system for the on-trade — built on real receipts, not panels or estimates.
PRICING INTELLIGENCE
Make pricing smarter
Track how venues set prices, how consumers respond, and how to optimize by segment or region.
COMPETITIVE BENCHMARKING
Outsmart competition
See where rivals gain share, which brands drive it, and which battlegrounds you need to defend.
ACTIVATION EFFECTIVENESS
Double down on what works
Measure the true ROI of promotions, events, and activations with control-group precision.
CROSS-MARKET VIEW
Win across Europe
One framework, every market. Compare performance through a single harmonized structure.
OCCASION INSIGHTS
Lead key occasions
Own the moment that matter - from after-work drinks to seasonal peaks and live sport.
VENUE-LEVEL INTELLIGENCE
Become a partner of growth
Turn data into dialogue. Support every sales conversation with venue-level facts.
BRAND ACTIVATION ON POS
Reward what sells
Pay venues directly through their POS for every product they sell - measured live, paid weekly.
FIELD SALES - NEXT BEST ACTION
Sell with intelligence
A field-sales cockpit that turns every visit into a data-driven conversation - Next Best Action, in real time.
USE CASE
01
Make pricing smarter.
Lead, don't follow.
What customers keep asking
"Are we pushing prices too far, or should we even lower the price of a pint?"
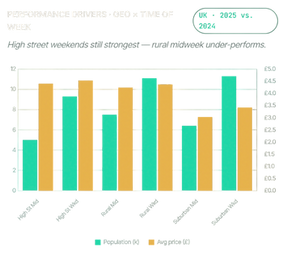
"If we recommend prices, how should we do that differently in rural UK versus London?"
"When we increase prices, how do venue owners actually pass that on?"
"Why do some brands lose volume after a price increase while others don't?"


ACTIONABLE INSIGHTS

Tailor price strategy to venue type and local reality, not one national rule.
Use venue-level data to flag outlets pricing above or below the optimal range.
Equip fiels teams with data-backed stories to build pricing confidence.
Time price updates to when venues naturally adjust menus - project margins on both sides.
USE CASE
02
Outsmart competition.
See what others can't.
What customers keep asking
"Where are competitors growing faster — and in which venue types or regions?"
"Which brands are taking space on menus or taps that used to be ours?"
"Where is our portfolio stronger or weaker, and how do we rebalance?"
"How can we anticipate competitive moves before they impact our share?"


ACTIONABLE INSIGHTS
Identify competitor hotspots: markets, regions, and venue types where rivals outperform.
Strengthen portfolio fit: deploy the right brands for the right battleground.
Identify clear strengths and weakness in your portfolio versus key competitors.
Turn competitive data into action; know you're losing, and how to win in back.
USE CASE
03
Double down on what works.
Cut what doesn't.
What customers keep asking
"Which activations actually move the needle, and which ones don't?"
"How much uplift did our last campaign really deliver in sales or distribution?"
"How do venue types or regions respond to the same campaign?"
"What's the ROI of our investment in POS materials, promotions, or visibility?"


ACTIONABLE INSIGHTS
Tailor price strategy to venue type and local reality, not one national rule.
Use venue-level data to flag outlets pricing above or below the optimal range.
Equip fiels teams with data-backed stories to build pricing confidence.
Time price updates to when venues naturally adjust menus - project margins on both sides.
USE CASE
04
Win across Europe.
One framework, every market.
What customers keep asking
"Which competitive insights hold across the EU — and what role do local challengers play?"
"Do POS materials perform consistently, or should execution stay local?"
"Where do innovations have the highest potential based on real consumer behavior?"
"Which cross-market trends accelerate fast — and where are we underestimating growth?"


ACTIONABLE INSIGHTS
Align on shared playbooks for on European strategy on pricing, occasions, and impact.
Anticipate future shifts through early signals - stay ahead and lead emerging trends.
Combine FYRE dashboards into a single CMI hub for the on-trade.
Enable faster knowledge charing and joint experiments between countries.
USE CASE
05
Lead key occasions.
Own the moments that matter.
What customers keep asking
"Which moments actually drive the biggest spikes — holidays, sport, weekends?"
"How do drinking occasions differ between regions and venue types?"
"Which brands are winning food-led occasions, and why?"
"How do we activate the right brand for the right occasion, instead of generic promos?"


ACTIONABLE INSIGHTS
Turn occasion learnings into stronger brand positioning - own sports, meals, and seasonal moments.
Drive premium upsell in food-led moments with data-backed brand recommendations.
Align portfolio strategy to occasions: promote the right brand for the right consumption moment.
Equip field teams with local "moment maps" per region or venue type.
USE CASE
06
Become a partner
of growth.
What customers keep asking
"How can we help each venue grow their business — not just our volume?"
"Which outlets have the biggest untapped potential, and what's holding them back?"
"What's the right pricing or product mix for each type of venue?"
"How do we make us the partner they want to talk to every month?"


ACTIONABLE INSIGHTS
Move from seller to advisor - discuss growth levers: pricing, assortment, activations.
Tailor brand mix and pricing to outlet performance, region, and consumer profile.
Spot at-risk venues early and provide targeted recovery plans.
Reward partnership: recognize high-performing outlets with visibility and co-marketing.
USE CASE
07
Reward what sells.
Pay venues at the till.
What customers keep asking
How do we make sure trade incentives actually reach the venues that pour our brand?"
"Can we move from quarterly rebates to live, transaction-based rewards?"
"How do we know a campaign is being executed — not just invoiced?"
"Which venues responded to the activation, and which ignored it?"


ACTIONABLE INSIGHTS
Move trade spend from blind rebates to verified, receipt-based rewards.
Trigger campaigns instantly across thousands of venues without field intervention.
Detect non-execution within 24 hours, and reallocate budget to outlets that perform.
Match the reward to the venues: cash for some, free stock or experiences for others.
USE CASE
08
Sell with intelligence.
Every visit, a data-driven conversation.
What customers keep asking
"How do we equip every rep with the same level of insight as our best one?"
"Which outlet should I visit next — and what should I say when I get there?"
"How do I prove an opportunity to a sceptical publican without a deck?"
"How do we measure rep effectiveness on real outcomes, not visit counts?"


ACTIONABLE INSIGHTS
Equip every rep with the same evidence base - eliminate variance between best and average.
Replace gut-feel routing with a scored prospect list and an AI-generated pre-visit brief.
Score reps on outcomes (listings, ROS uplift, RSP compliance) - not visit counts.
Coach with data: reproduce what works, intervene early on what doesn't.

FYRE enables brands to embrace data innovation and lead the transformation of the on-trade, with confidence, not risk.
Book a 30-minute walkthrough of your category in your market. We'll show you live receipts from connected venues and the questions FYRE is already answering for Heineken, CCEP, Diageo and others.